what-are-latest-infection-rates-covid-19-exponential-growth-chart-comparison
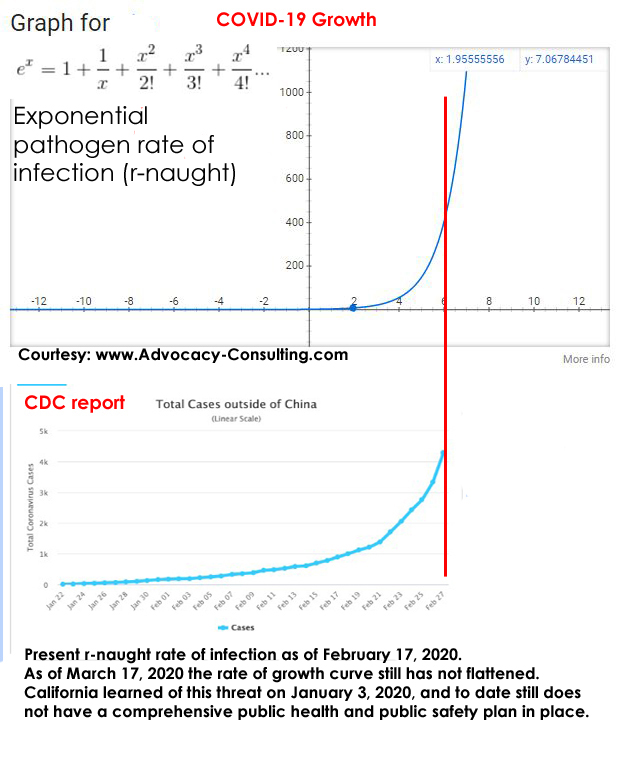
The math doesn’t lie. The infection rate of COVID-19 virus follows an exponential e^x rat (y = e raised to the power of x), if a comprehensive action plan is not put in place for public health and public safety policies to slow and effectively stop the spread of infection.